The Crypto Market Cap (TOTALCAP), Bitcoin (BTC), and ImmutableX (IMX) fell after the RSI generated a bearish divergence.
In the news today:
- Axie Infinity Co-Founder Jeff Zirlin announced that his crypto wallet was hacked, resulting in $9.7 million stolen.
- Reddit revealed that it invested in BTC, Ethereum (ETH), and Polygon (MATIC), signaling a bullish stance.
TOTALCAP Falls After Divergence
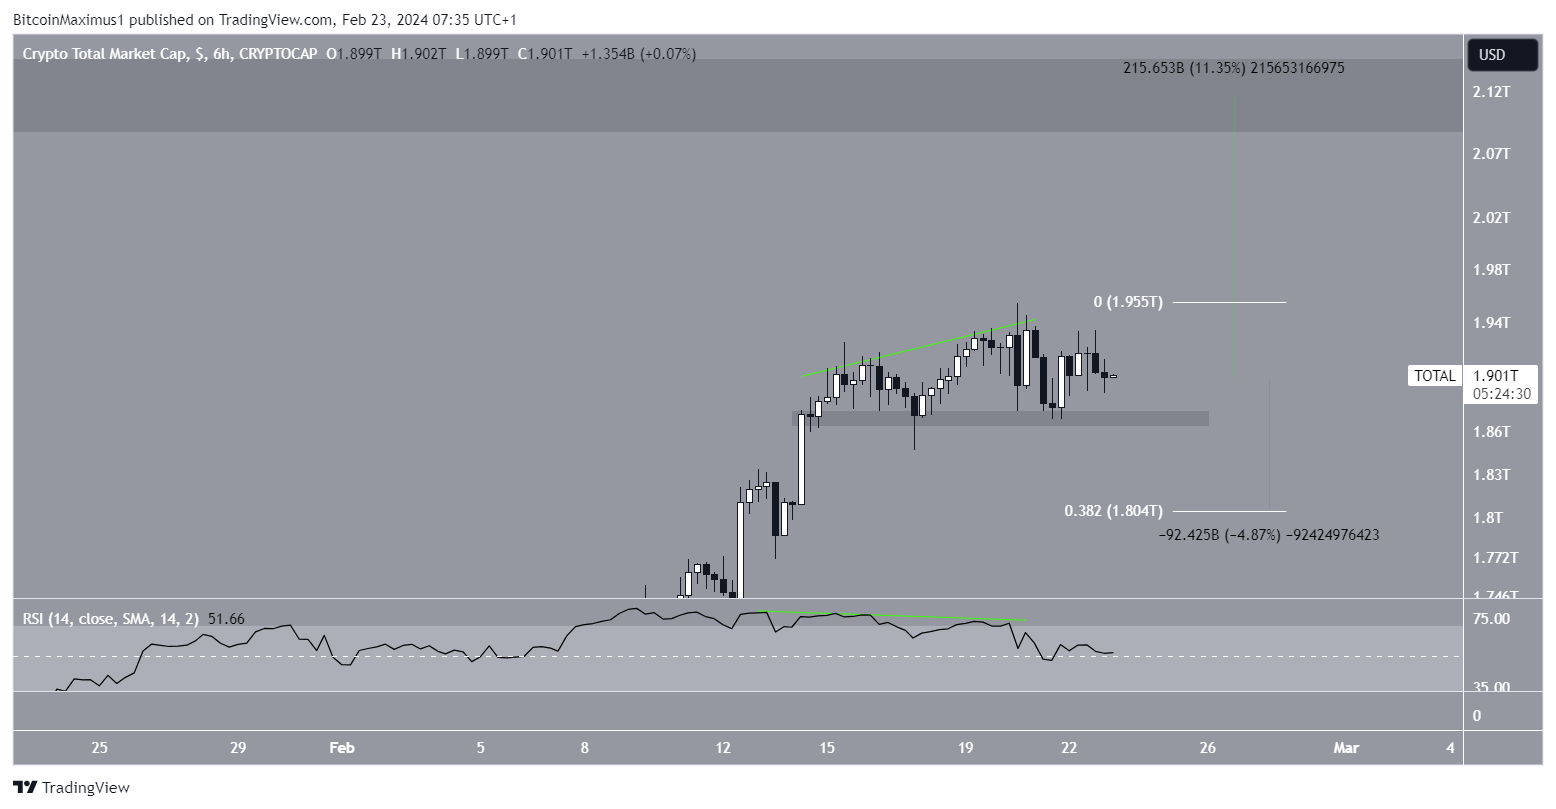
The cryptocurrency market cap has been moving upward since January 22. The increase culminated with a new yearly high of $1.95 trillion on February 20. However, the price has fallen since, reaching the $1.87 trillion support area.
A bearish divergence in the six-hour RSI (green trend line) preceded the decrease. Traders utilize the RSI as a momentum indicator to assess whether a market is overbought or oversold and whether to accumulate or sell an asset.
If the RSI reading is above 50 and the trend is upward, bulls still have an advantage, but if the reading is below 50, the opposite is true. A bearish divergence occurs when a momentum decrease accompanies a price increase. It often leads to downward movements.
If TOTALCAP breaks down from the $1.87 trillion support, it can decrease by 5% and reach the 0.382 Fibonacci support level at $1.80 trillion.
Read More: Where to Trade Bitcoin Futures

Despite this bearish TOTALCAP prediction, moving above the $1.95 trillion high can trigger an 11% increase to the next resistance at $2.10 trillion.
Bitcoin Returns to Support
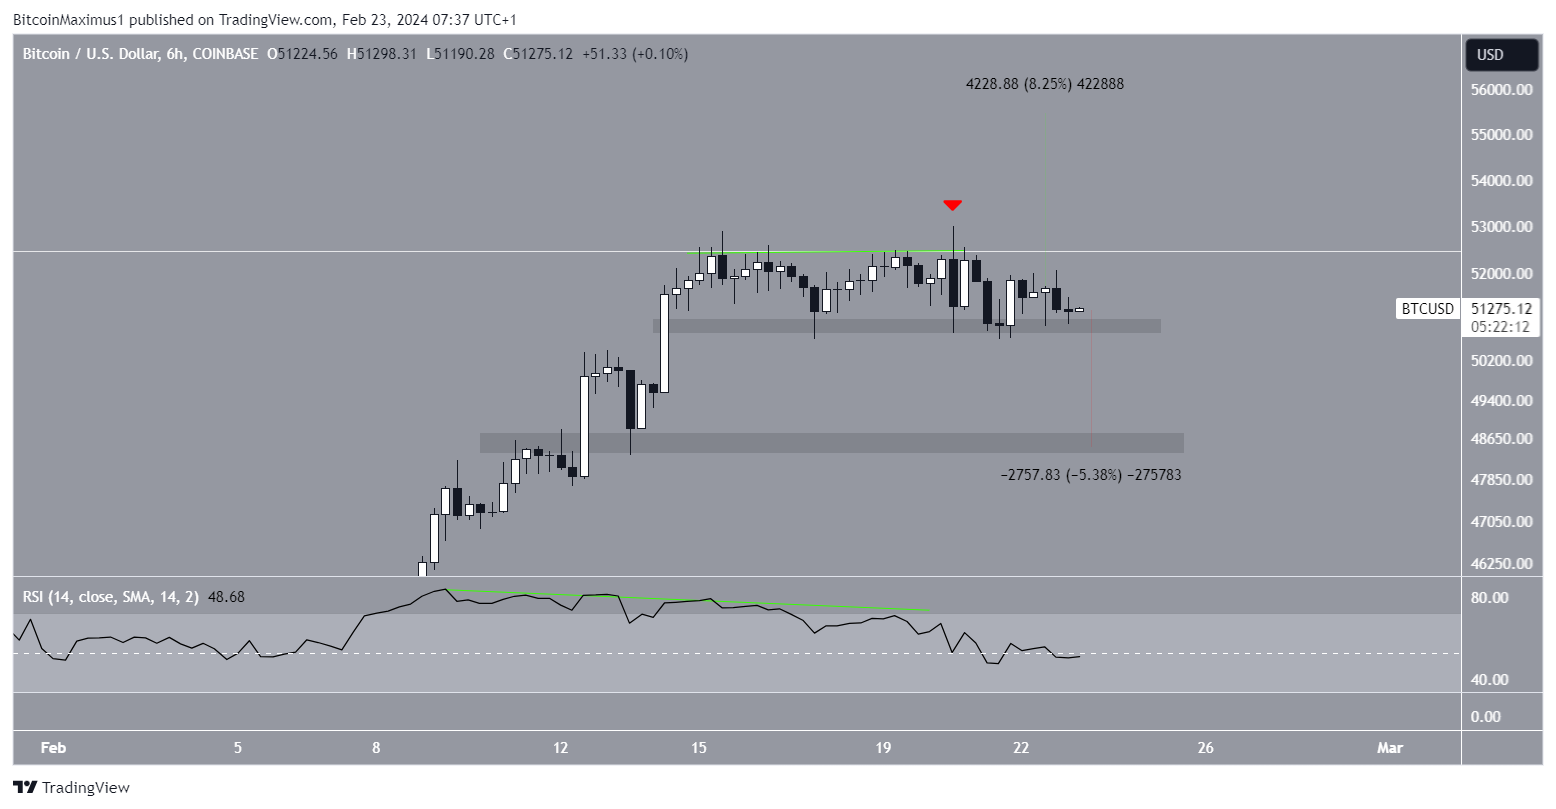
The Bitcoin price has also increased since January 22. The increase accelerated in February, culminating with a new yearly high of $53,000 on February 20.
However, BTC fell afterward, confirming a deviation above the previous range high (red icon), and returned to the $50,800 support. The price bounced afterward. Similarly to TOTALCAP, the downward movement was preceded by a bearish divergence in the six-hour RSI, which is now below 50. If BTC breaks down, it can fall 6% to the closest support at $48,500.

Despite this bearish Bitcoin price prediction, moving above the yearly high of $53,000 can catalyze a 7% increase to the next resistance at $55,500.
Read More: What is a Bitcoin (BTC) ETF?
IMX Shows Weakness
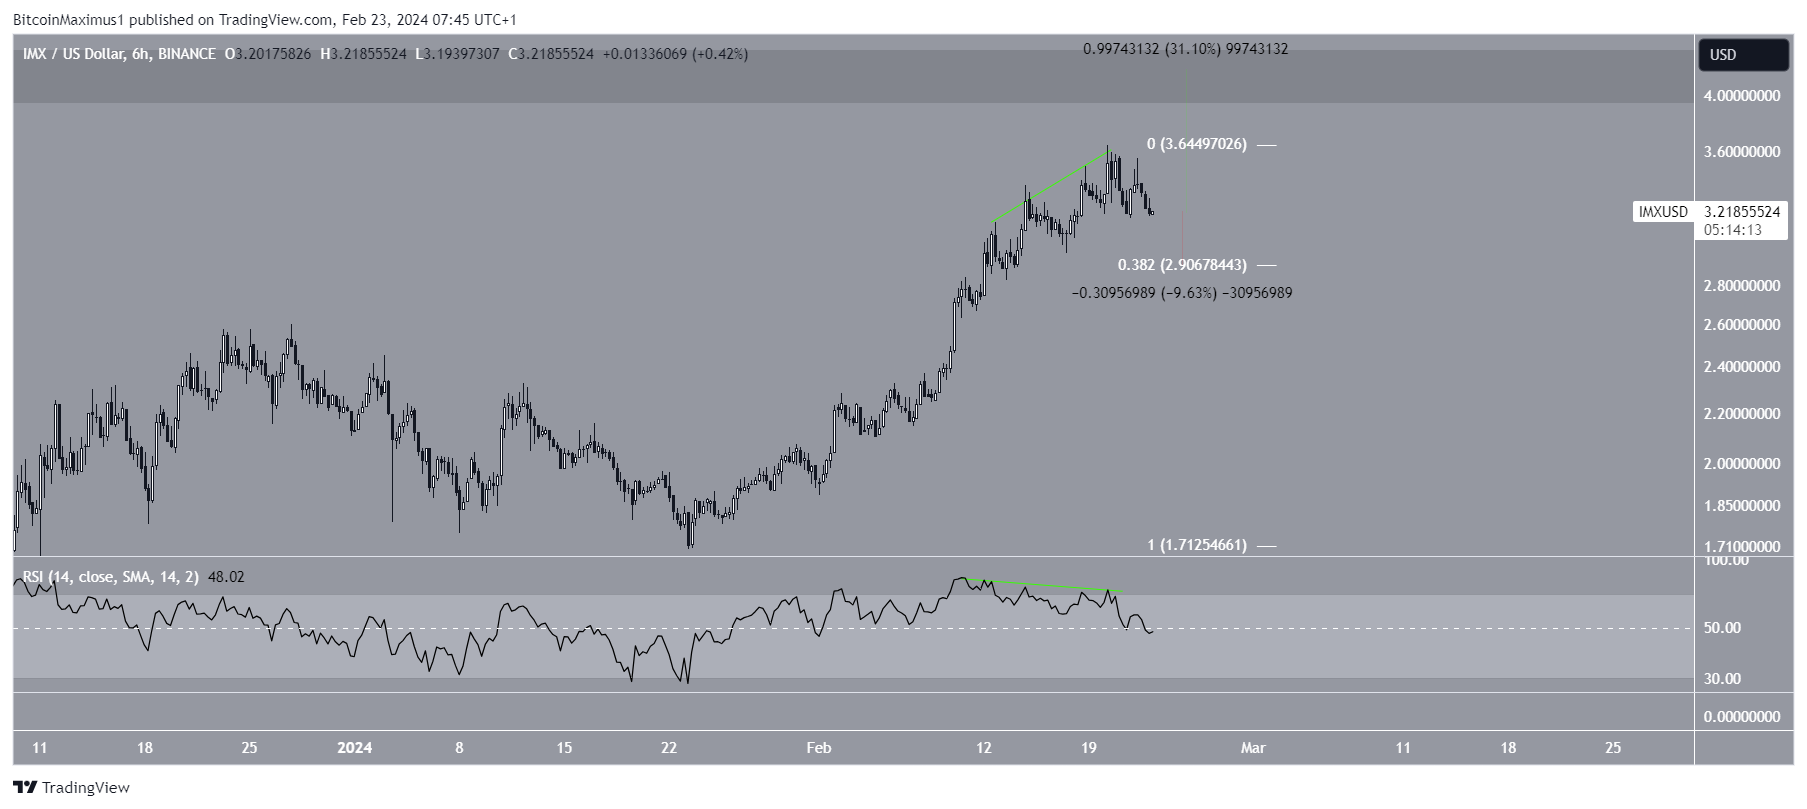
The IMX price has increased since January 23. The upward movement led to a high of $3.65 on February 20.
However, the IMX price has fallen since. Similarly to BTC and TOTALCAP, the movement was preceded by a bearish divergence in the RSI. The price created a lower high on February 22. If the decrease continues, IMX can reach the 0.382 Fib retracement support level at $2.90.

Despite the bearish IMX price prediction, moving above the previous high of $3.65 can trigger a 30% increase to the next resistance at $4.20.
For BeInCrypto‘s latest crypto market analysis, click here.
Trusted
Disclaimer
All the information contained on our website is published in good faith and for general information purposes only. Any action the reader takes upon the information found on our website is strictly at their own risk.


