The Bitcoin (BTC) price is teeming with bullish indicators, notably the consistent growth in wallets holding at least 1,000 BTC for the past five days. Concurrently, BTC supply on Coinbase has plummeted to its lowest since 2018, highlighting a significant withdrawal of Bitcoin from exchanges.
This scarcity on trading platforms, combined with the technical momentum where short-term Exponential Moving Average (EMA) lines have surged past long-term lines, sets the stage for a potential bull run. These elements suggest an imminent upward trend, which paints a hopeful picture for BTC’s future.
Whales are Accumulating Bitcoin Again
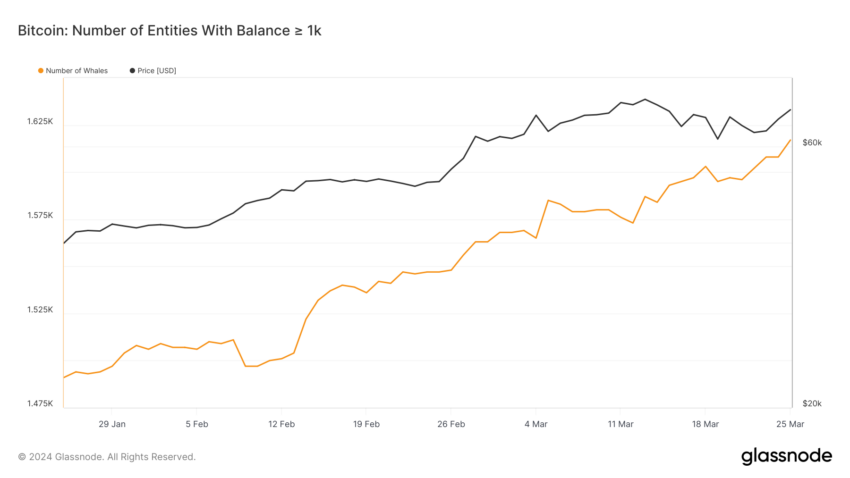
Between January 25 and March 25, the number of Bitcoin addresses holding at least 1,000 BTC expanded from 1,491 to 1,617. This rise represents the highest number of so-called BTC whales since February 2021. This is another indication of institutional interest in Bitcoin.
The surge in whale activity has been particularly pronounced over the last five days, with the number climbing from 1,596 to 1,617. Such assertive accumulation by major addresses may serve as a proxy to the broader market, hinting that a bull run may be imminent.

The aggressive acquisition by these whales is often perceived as a positive market indicator. It suggests that well-capitalized players are preparing for an upward shift in BTC’s price trajectory. As a result, this can instill greater confidence in retail and smaller institutional traders.
If they interpret whales’ investment behaviors as a reliable forecast, they may increase their market participation, which can further fuel the price ascendancy. Thus, monitoring these whale populations can provide insight into potential large-scale market movements, as their buying patterns can be a precursor to significant price rallies in the Bitcoin ecosystem.
Read More: 7 Best Crypto Exchanges in the USA for Bitcoin (BTC) Trading
Supply Squeeze on Coinbase
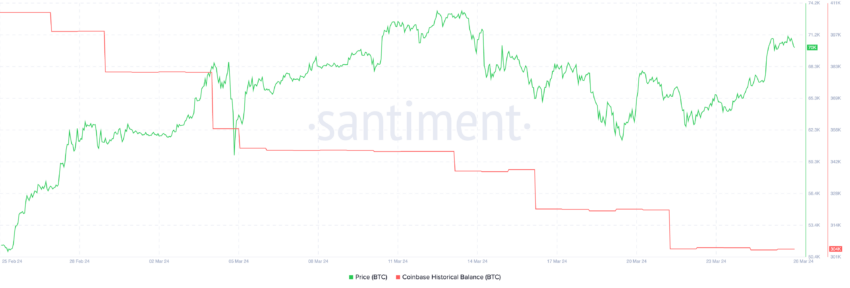
The BTC supply on Coinbase, the largest US exchange, has been on a steady decline since the year’s onset, culminating recently at just 304,000 BTC. This significant figure marks the lowest BTC supply level on Coinbase observed since 2018, underscoring a dwindling availability of Bitcoin on the market platform.
Such a reduction in supply, especially on a leading exchange like Coinbase, is a noteworthy development, signaling a tightening of available Bitcoin for trading and purchase.

A constrained supply often precedes a price increase, as the basic economic principle of demand and supply suggests. In the context of BTC, a lower supply on a major exchange indicates that fewer bitcoins are available for buyers. This also reflects a broader market sentiment of holding rather than selling, suggesting investors are optimistic about future price movements.
This scenario sets the stage for a potential bull run, as the decreased supply on Coinbase can lead to increased competition among buyers, driving up the price. Coupled with more whales accumulating BTC recently, the current supply dynamics on Coinbase may very well be the precursor to a significant upward trend in BTC’s price.
BTC Price Prediction: A New All-Time High Soon?
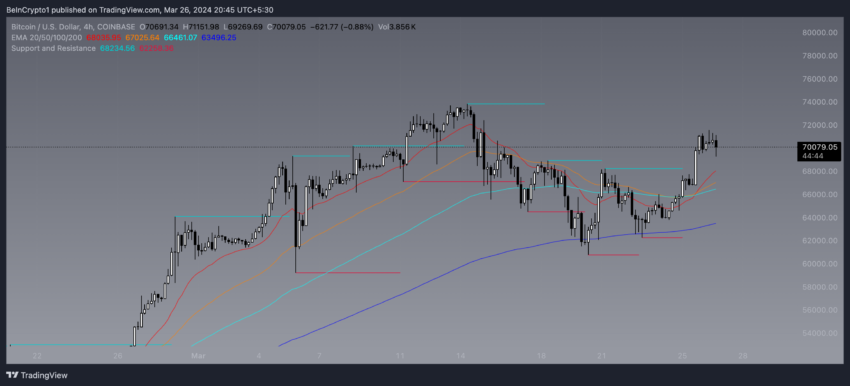
The BTC 4-hour chart presents a bullish signal. A short-term EMA line has crossed above a long-term EMA line, suggesting an uptick in buying pressure and a potential continuation of the current uptrend. EMA, or Exponential Moving Average, lines are trend indicators that give greater weight to more recent price data, making them more responsive to price changes than simple moving averages. This responsiveness can provide earlier signals of market sentiment shifts.

The recent crossover, often seen as a bullish sign, can be the precursor to a robust upward trajectory, possibly driving BTC toward a new all-time high (ATH) if the trend gains sufficient momentum and investor confidence remains high. The current ATH is $73,797.35, and with a new Bitcoin halving getting closer every day, a new ATH for BTC shouldn’t sound crazy.
Read More: Bitcoin Price Prediction 2024/2025/2030
Conversely, should this uptrend falter or external market factors introduce uncertainty, there’s a risk that the BTC price could retract. If buying pressure eases and the market can’t sustain the upward momentum indicated by the EMA crossover, Bitcoin may retest lower support levels, potentially revisiting the $60,000 mark.
Trusted
Disclaimer
In line with the Trust Project guidelines, this price analysis article is for informational purposes only and should not be considered financial or investment advice. BeInCrypto is committed to accurate, unbiased reporting, but market conditions are subject to change without notice. Always conduct your own research and consult with a professional before making any financial decisions. Please note that our Terms and Conditions, Privacy Policy, and Disclaimers have been updated.


