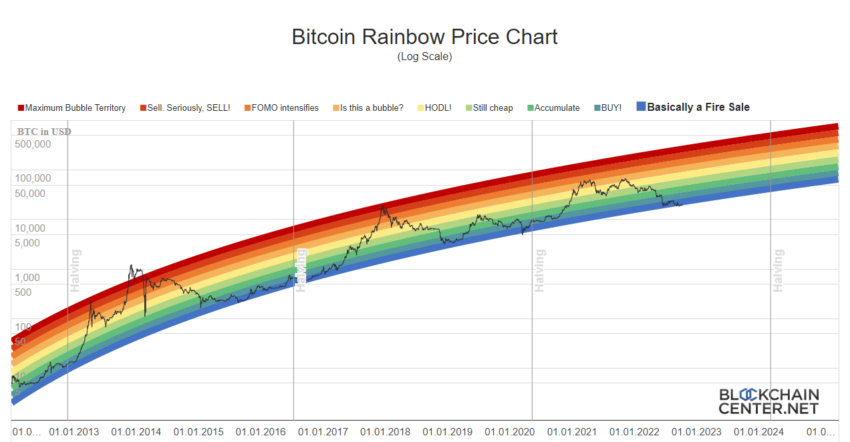
Bitcoin Price Prediction: The Bitcoin Rainbow Chart indicates that the Bitcoin (BTC) price may have bottomed out. Also, the chart shows that a new rally toward $600,000 could begin.
The leading cryptocurrency Bitcoin continues its hovering in the range of $19,000 to $21,000. The consolidation and the lessening volatility of the Bitcoin price indicates that the price is stabilizing. Also, the Bitcoin rainbow chart shows that the BTC price may have bottomed out.
The Rainbow Chart and BTC Price
The BTC price rainbow chart is one of the oldest tools used to look at the long-term price of Bitcoin. It is known for its fun chart image. The chart is called a rainbow because it shows market sentiment with colored bands. These can indicate when traders will buy or sell in different Bitcoin price ranges. According to the cryptocurrency chart, BTC price is currently in the blue zone at the bottom of the rainbow and has reached the bottom.
Although the blue zone is known as the point where the fire goes out, it should be remembered that market expectations are not yet in the direction of the bottom price. The fear and greed index is in the extreme fear zone with 28 points. This means that confidence in Bitcoin price is not yet established.

Rainbow Bitcoin Chart. Source: Blockchaincenter
Bitcoin Price Prediction: Building Support Before New ATH
The Bitcoin Rainbow Chart indicates that if BTC price follows the long-term ongoing pattern, it could reach the ‘Maximum Bubble Zone’ represented by dark red. According to the chart, the Bitcoin price could reach $626,383 by October 9, 2024.
The last time the blue band (which coincides with the current price level) was reached, Bitcoin price started a rally from $5,000 (March 2020) to $69,000 (November 2021). The chart shows that the possible new rally to $600,000 will start at $84,000 at the end of the year. On the other hand, it should be noted that the rainbow chart lacks macro and micro developments and is only BTC price oriented.
The creators of the chart point out that this is a fun way to look at Bitcoin price potential future performance.
Got something to say about this Bitcoin price prediction or anything else? Write to us or join the discussion in our Telegram channel. You can also catch us on Tik Tok, Facebook, or Twitter.
Opinions seen on this website should not drive any financial decisions from readers.
Trusted
Disclaimer
In compliance with the Trust Project guidelines, this opinion article presents the author’s perspective and may not necessarily reflect the views of BeInCrypto. BeInCrypto remains committed to transparent reporting and upholding the highest standards of journalism. Readers are advised to verify information independently and consult with a professional before making decisions based on this content. Please note that our Terms and Conditions, Privacy Policy, and Disclaimers have been updated.


